

Consumer Sentiment
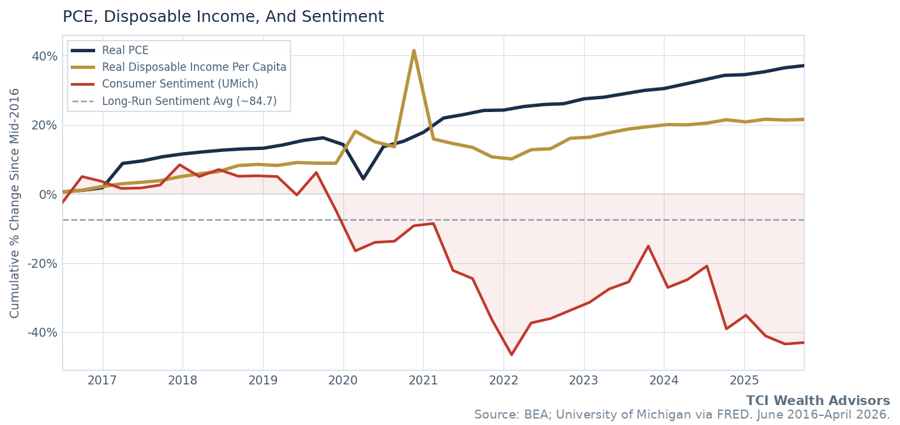
On May 8th, the University of Michigan reported that consumer sentiment fell to 48.2, setting a new all-time low for the second consecutive month, and dropping below levels recorded during both the pandemic and the global financial crisis.
Yet economic reality tells a very different story. Employment has remained steady, consumer spending continues to grow, and equity markets have reached new highs. The disconnect between how people say they feel and what the data shows is more than a curiosity. For investors, it raises an important question: What does consumer sentiment measure, and how much weight should it carry?
At TCI Wealth, we have found that the costliest investment mistakes rarely stem from flawed analysis. They occur when sentiment overrides the evidence-based principles on which a sound investment plan is built. Consumer sentiment is one of the most widely cited and least understood economic measures. In today’s environment, it is also one of the most consequential to misread. This piece examines what it captures, why it has diverged from economic reality, and why that distinction matters for investors seeking to remain grounded amid persistent noise.
Understanding Consumer Sentiment: Purpose and Limits
The University of Michigan’s Consumer Sentiment Index measures how Americans feel about the economy rather than how they behave. That distinction is critical. Consumer sentiment is not a measure of spending, income, employment, or balance sheet strength, nor is it a record of real economic activity. Instead, it captures perceptions and expectations, making it inherently subjective and highly sensitive to how information is framed and consumed.
This background is especially important today. Since 2019, consumer sentiment has become increasingly detached from traditional indicators of economic health. The index has spent much of this period below its long-term historical average. Even as employment remained strong, incomes rose, and consumer spending continued to grow.
Elective Spending: Where Behavior Diverges from Sentiment
If declining sentiment reflected genuine economic retrenchment, it would be most visible in elective spending. These discretionary categories are typically the first to be reduced when financial pressure rises. However, one of the most optional areas of the economy, live entertainment, has remained notably resilient.
Concerts and sporting events provide a useful case study. These are not essential expenses, and they are highly visible and price transparent. If declining confidence were shaping behavior, demand in these areas would be weakening.
The opposite has occurred. Several indicators illustrate this clearly:
- Live Nation reported record revenue of $25.2 billion in 2025, a 9 percent increase year after year, and hosted 159 million fans. Higher ticket prices have coincided with increased attendance, and not weaker demand.
- Taylor Swift’s Eras Tour generated more than $2.0 billion and sold over 10 million tickets, making it the highest-grossing tour in history despite rising prices and persistent sellouts.
- NFL ticket prices rose 173 percent on an inflation-adjusted basis between 2015 and 2025, far exceeding general inflation. Attendance has remained strong, with stadiums typically operating near capacity and recent seasons averaging roughly 98 percent occupancy.
These examples are not isolated. Broader data shows the same pattern. The Federal Reserve’s Recreation Services Expenditure Index reflects a long-term upward trend, briefly interrupted during the pandemic and followed by a strong recovery. Discretionary, experience-driven spending continues to rise even as sentiment surveys remain subdued.
 A Common Objection: Is This Being Sustainably Funded?
A natural next question is whether this resilience is financially sustainable or supported by increasing strain. To assess this, it is necessary to look beyond sentiment and spending and examine household credit conditions.
Post-pandemic borrowing must be viewed in context. Household debt burdens fell sharply during the pandemic, reaching unusually low levels as income support rose, and spending opportunities declined. Since then, credit use has increased, largely reflecting normalization rather than growing stress.
The Federal Reserve’s Household Debt Service Ratio supports this view. While the ratio has risen from pandemic lows, it remains below pre-pandemic levels and well below the peaks seen prior to the global financial crisis. Even after several years of higher interest rates, households are still dedicating a smaller share of income to debt service than in past periods that constrained behavior.
 Credit card delinquency data reinforces this interpretation. Delinquencies have increased from unusually low levels but remain well below thresholds associated with systemic consumer stress. The overall pattern suggests balance sheet normalization within a still-healthy range.
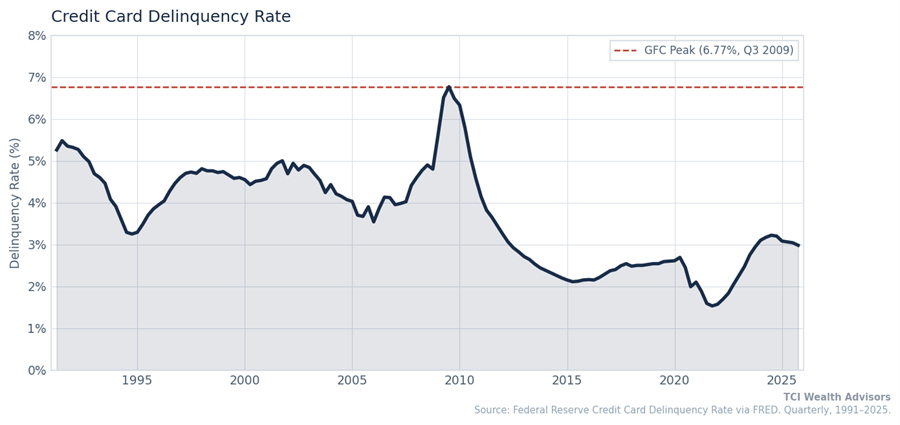 This distinction matters. Rising balances following an artificially suppressed period do not indicate unsustainable behavior. If discretionary spending were being supported by financial strain, that stress would appear first in higher payment burdens and rapidly rising delinquencies. Neither trend is reflected in current data.
Taken together, measures of debt service and payment performance align with broader spending data. Households, in aggregate, remain capable of supporting their consumption decisions despite persistently pessimistic sentiment readings.
From Behavior to Profits to Markets
For investors, this disconnect is not academic. What matters is whether underlying economic activity translates into corporate earnings and long-term market value. On that front, the signal has been consistent.
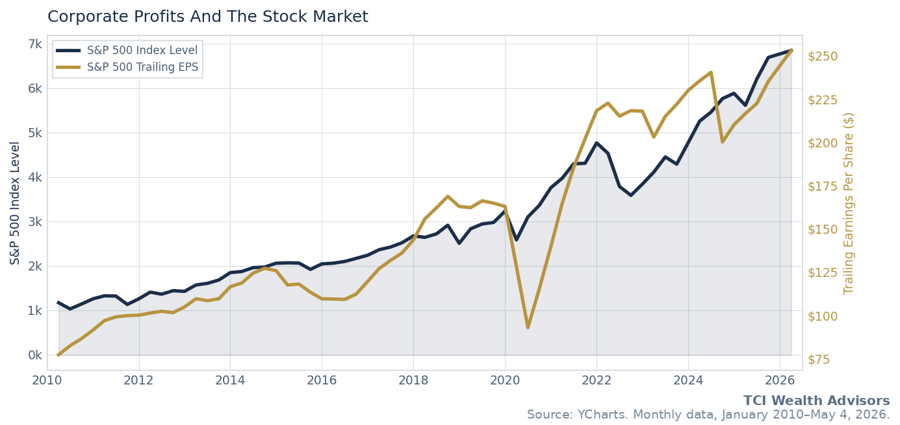
Despite weak sentiment readings, corporate profits have continued to grow, and equity markets have advanced alongside them. The same behaviors driving discretionary spending, resilient demand, and pricing power are visible in earnings and stock performance.
Across the economy, companies have demonstrated an ability to:
- Maintain demand even as prices rise
- Protect or expand margins
- Convert consumer activity into sustained earnings growth
This is notable given the backdrop implied by sentiment surveys. Higher interest rates, persistent inflation narratives, and widespread discussions of consumer strain have not prevented earnings growth or pushed profit levels below historical norms.
At the market level, the relationship remains clear. Equity markets and corporate profits have moved in tandem, with rising earnings supporting higher valuations and pushing indices to new highs. This reflects an environment where fundamentals remain intact, even if confidence surveys suggest otherwise.
The result is a stark contrast. One of the most pessimistic sentiment environments in decades has coincided with one of the strongest profit and market backdrops in history. This is not a contradiction. It is the core insight.
The implication for investors is straightforward. Sentiment influences narratives and headlines, but earnings and cash flows ultimately drive long-term market outcomes.
 When Narratives Diverge from Reality
Given this backdrop, a natural question emerges. Why has consumer sentiment remained so pessimistic?
Part of the answer lies in how economic information is filtered and presented. Reporting is often shaped by negativity bias. Adverse developments tend to attract more attention and engagement than positive ones. Research from the Brookings Institution suggests that the tone of U.S. economic news has become increasingly negative over time, even after accounting for changes in underlying conditions.
Inflation and visible price increases provided a factual basis for concern. However, they do not fully explain the persistence or intensity of negative sentiment. Narratives have often originated from specific experiences to suggest a broader economic fragility. Over time, this framing has influenced public perception, causing sentiment to reflect headline tone more than underlying fundamentals.
Understanding this dynamic is essential. Without it, it is easy to mistake a measure of mood for a measure of reality or to interpret persistent pessimism as a signal of weakening fundamentals rather than a reflection of narrative influence.
What This Means for Investors
The divergence between sentiment and reality is not something to resolve. It is a condition to navigate. Periods of elevated pessimism have often coincided with moments when long-term investors are most tempted to act and most rewarded for remaining disciplined.
By the time sentiment recovers, markets have often already adjusted.
At TCI Wealth, our evidence-based approach is designed to help navigate this environment. The focus is not on predicting when confidence will return, but on maintaining a plan even when headlines challenge it. Discipline in these moments is not passive. It can be an important part of allowing a long-term investment plan and compounding to work over the long term.
References
Live Entertainment
- Live Nation Entertainment (2025). Full Year 2025 Financial Results.
- Pollstar (2024). Taylor Swift Eras Tour Becomes First to Surpass $2 Billion.
Professional Sports
- News Minimalist (2026). NFL ticket prices nearly triple from 2015 to 2025.
- Sports Business Journal (2026). NFL attendance data.
- FinanceBuzz (2026). NFL Inflation: Tracking Ticket and Concessions Prices.
- Axios (2026). Sports ticket prices soar as teams chase premium clientele.
Media & Consumer Perception
- Harris, B. H. & Sojourner, A. (2024). Is the economic news becoming more negative, and does it matter for consumers? Brookings Institution.
All data is from publicly available sources and are presented for informational purposes only.
TCI Wealth Advisors, Inc. is an SEC registered investment advisor. This material is provided for informational purposes only and should not be construed as investment advice or a recommendation. TCI is neither a law firm nor a certified public accounting firm, and this material should not be construed as legal or accounting advice. Moreover, you should not assume that any discussion or information contained herein serves as the receipt of, or as a substitute for, personalized investment advice. This material may include information, data, charts, graphs, or analysis obtained from third-party sources believed to be reliable. TCI has not independently verified all such information and does not guarantee its accuracy, completeness, or timeliness. TCI may discuss and display charts and graphs, which are not intended to be used by themselves to determine which securities to buy or sell, or when to buy or sell them. Such charts and graphs offer limited information and should not be used on their own to make investment decisions. Consultation with a licensed professional is strongly suggested.
The opinions expressed herein are those of the firm and are subject to change without notice. The opinions referenced are as of the date of publication and are subject to change due to changes in the market or economic conditions and may not necessarily come to pass. Any opinions, projections, or forward-looking statements expressed herein are solely those of author, may differ from the views or opinions expressed by other areas of the firm, and are only for general informational purposes as of the date indicated.

