
Markets rarely pause between quarters, and Q1 2026 was no exception. Headlines kept investors’ attention throughout the quarter: geopolitical escalation in the Middle East that drove oil prices sharply higher, continued back-and-forth on U.S. trade policy, and a pause in the upward trend of technology stocks as investors appeared to re-weight towards more value-oriented sectors.
If you followed the news closely, you might have expected your portfolio to reflect the turmoil. By most measures, it did not. In this letter, we examine the events of Q1 through TCI’s investment framework, taking a clear-eyed look at stock market performance as well as oil and inflation dynamics, and what this means for the long-term investor.
Volatility Is a Means, not a Malfunction
Markets did move in Q1, but the magnitude of those moves tells a quite different story from the one dominating financial media. The Russell 3000, a broad measure of the U.S. equity market, returned -4.25% for the quarter. For a period that included geopolitical shock, rising oil prices, and persistent trade policy uncertainty, market movement was remarkably contained.
The instinct to interpret headlines and short-term market movements as a signal to act is understandable. Financial media is designed to assign meaning to every move. But the historical record suggests a different interpretation. As the chart below illustrates, intra-year declines of 10% or more have occurred in fifty-six of the past 98 years of U.S. equity market history, while declines of 20% or more have occurred in nearly a third of all years. Measured against that backdrop, Q1 was a pedestrian quarter for equity markets.
 This is an important reframe. Volatility is not a sign that something has gone wrong. It is the mechanism through which long-term returns are realized — the cost of participating in the growth of businesses and economies over time. A market that never declined would offer no compensation for the uncertainty of remaining invested. Q1 may have felt uncomfortable, as markets periodically do. But when you are educated to understand that discomfort in context, you realize it is not a problem that needs solving, and that constructing a portfolio with this in mind ensures resilience.
Source: YCharts, as of March 31, 2026. Russell 3000 used as a proxy for broad U.S. equity market performance. Dimensional Fund Advisors, “An Intra-Year Decline of 10% is not Uncommon,” 1927–2024.
Oil, Inflation, and Recession: What the Data Actually Shows
Few topics garnered more attention in Q1 than the relationship between oil prices, inflation, and recession risk. That focus was driven by geopolitical escalation in the Middle East, which pushed oil prices sharply higher and raised concerns about broader economic effects.
What Actually Happened?
On February 28, U.S. and Israeli military action against Iran disrupted oil flows through the Strait of Hormuz, a waterway through which approximately 20% of global oil supply passes daily. Brent crude, which had traded in the low-to-mid $60s for much of late 2025, surged to close Q1 at $127 per barrel.
A recent comparison comes from early 2022, when Russia’s invasion of Ukraine triggered one of the most significant supply disruptions in decades and drove Brent crude to a peak of $133 per barrel. The current episode followed a strikingly similar path, closing Q1 at $127 per barrel — approaching, but not yet exceeding that prior peak and doing so from a materially lower starting point.
Where the two episodes differ is in their structural context. Global oil inventories entering this shock were elevated at over 8.2 billion barrels, the highest level since February 2021. In addition, IEA’s member countries unanimously agreed to release four hundred million barrels from strategic reserves. Those buffers matter.
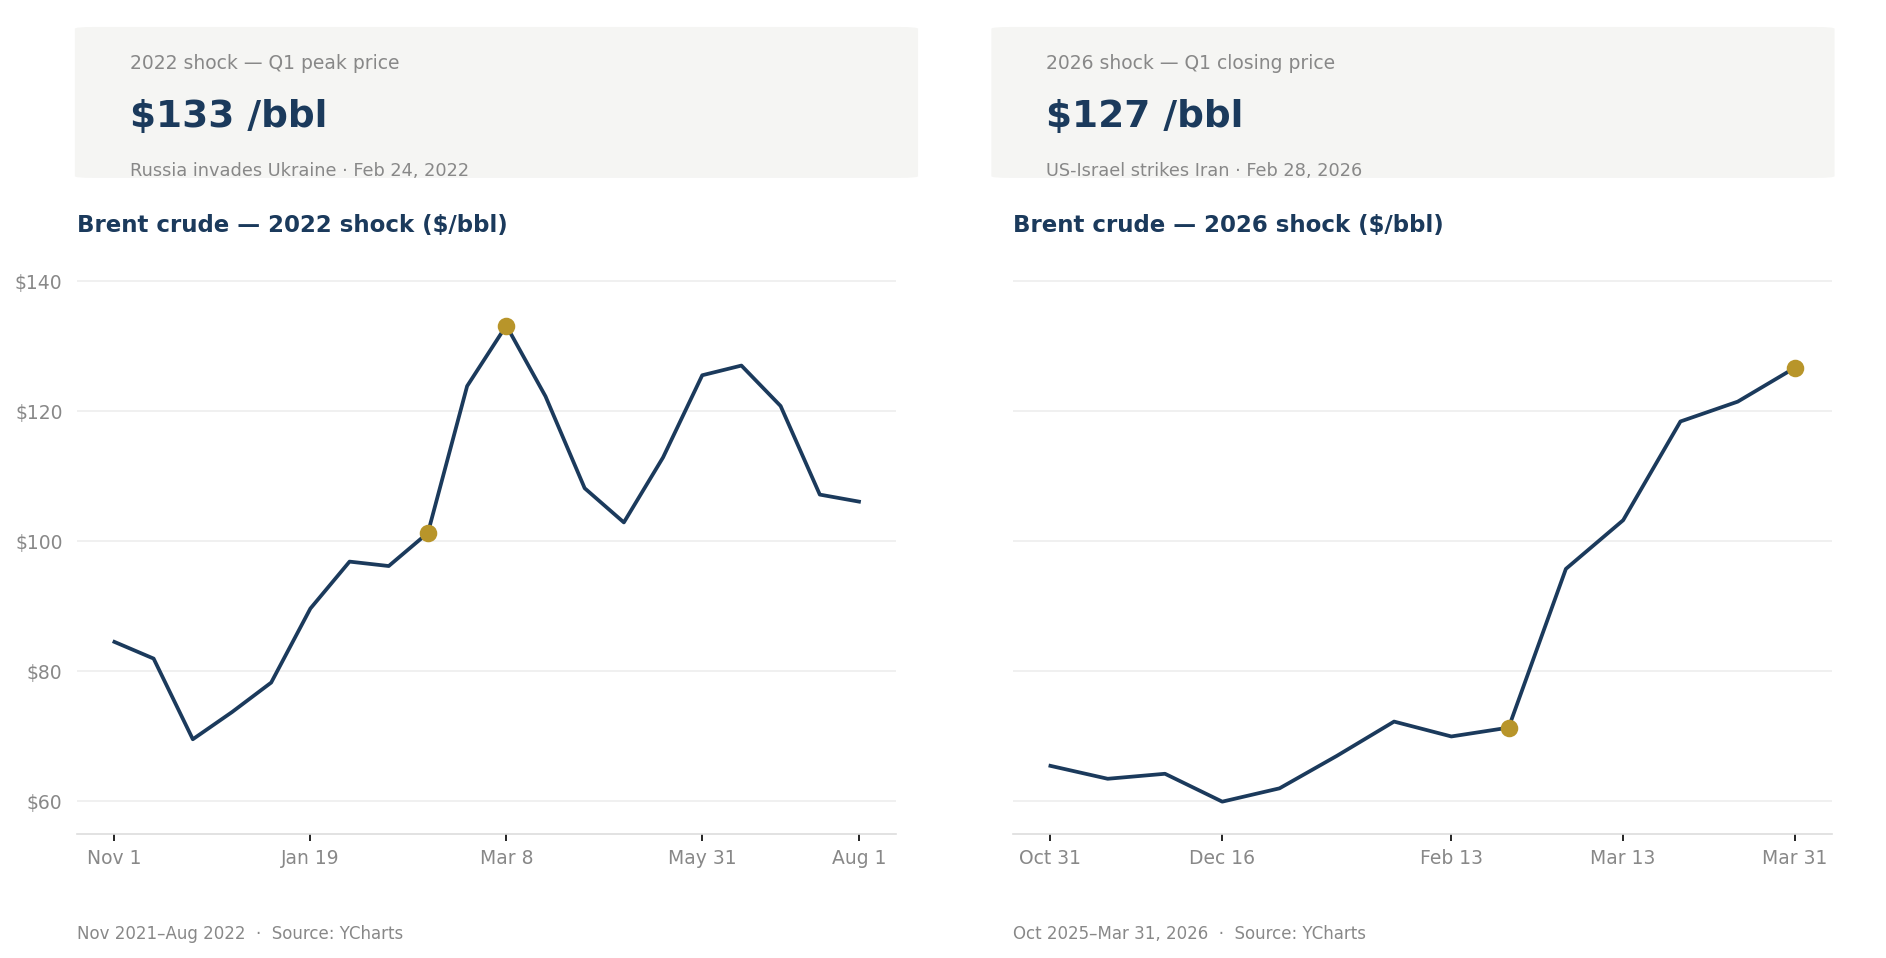
| Brent Crude Side-by-Side Charts: 2022 vs. 2026 (same y-axis scale) |
How Do Oil Prices Impact What Americans Pay?
The common assumption is intuitive. When oil prices rise, prices of other goods and services generally rise along with it. In practice, the extent to which an oil spike translates into a broad and lasting increase in the cost of living is far more limited than headlines suggest.
Energy represents only 6.3% of the average American household’s total spending, according to the Consumer Price Index. Gasoline, the most direct connection between oil prices and consumer costs, accounts for just 2.88%. Even a 50% increase in oil prices that flowed entirely through to gasoline would affect less than three cents of each dollar consumers spend.

| CPI Basket Composition: “How Americans Spend” |
That naturally raises a follow-up question: what about higher shipping, manufacturing, and food costs when energy prices rise? A 2022 Federal Reserve study examined this issue in detail. Even accounting for all energy prices together — gasoline, diesel, natural gas, and electricity — their combined contribution to 2022’s 8.1% average inflation rate was limited to just 1.1 to 1.8 percentage points. Energy prices were a marginal contributor, not a primary driver. The same structural logic applies today.
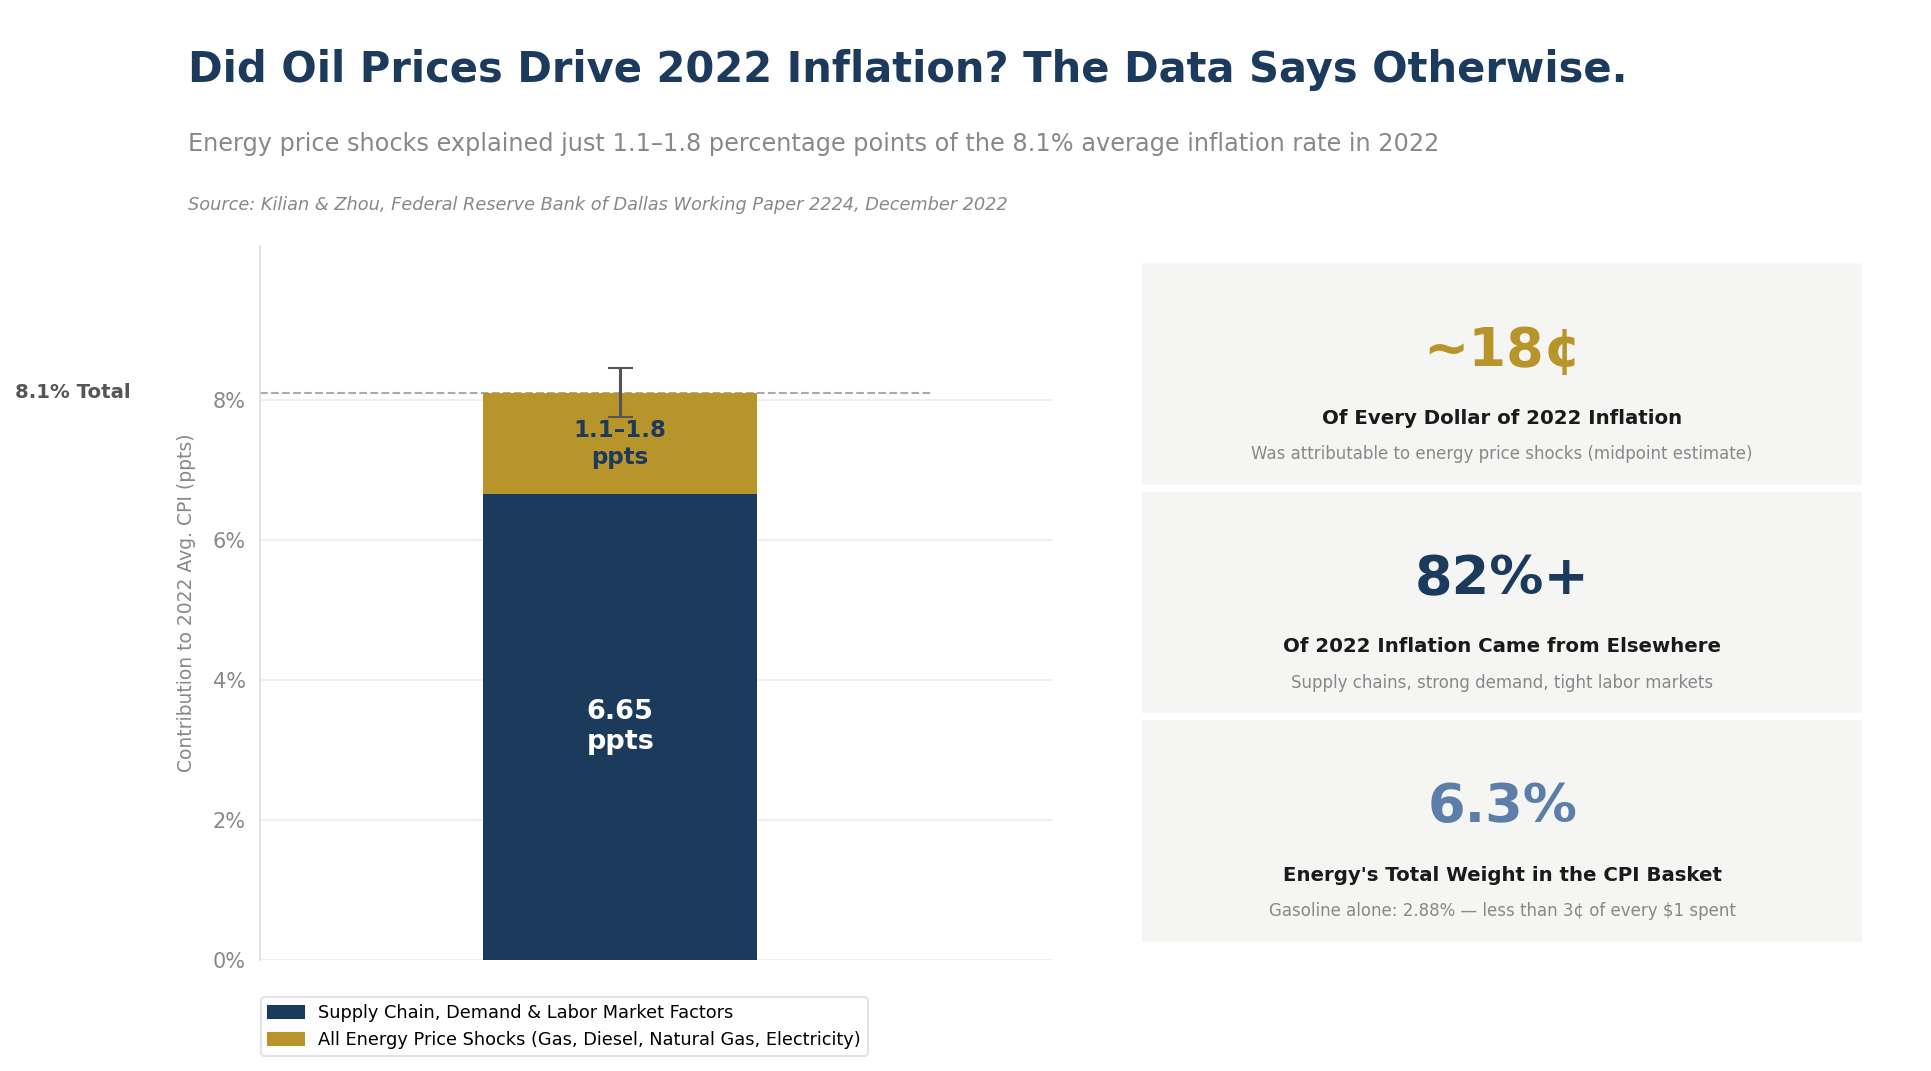
| Dallas Fed Inflation Decomposition: “Did Oil Prices Drive 2022 Inflation? The Data Says Otherwise.” |
Betting on Inflation: What Bond Markets Are Actually Pricing
While commentators debate about where inflation is heading, a deep and active market makes real-money bets every day. Investors trade standard Treasury bonds alongside inflation-protected securities, and the yield difference between the two— known as the breakeven inflation rate — reflects the inflation rate at which an investor would be indifferent between them. Research from Dimensional Fund Advisors describes it as the market’s ongoing, financially disciplined estimate of future inflation, continuously updated, real-money estimate of inflation’s path.
Despite elevated oil prices and disrupted supply, breakeven inflation rates entering the end of Q1 remained measured. Bond markets were pricing inflation expectations meaningfully below their 2022 peaks, reflecting a calmer view than that conveyed by headlines.
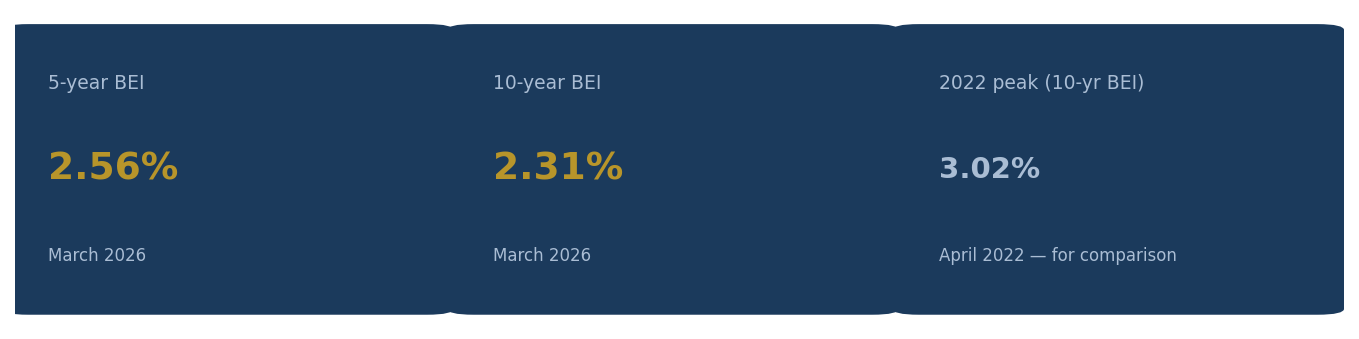
| Breakeven Inflation Rate Metrics (5-yr: 2.56%, 10-yr: 2.31%, 2022 peak: 3.02%) |
Market signals are never perfect and will adjust as conditions evolve. What makes them informative is their accountability. A market participant who misjudges inflation may lose money. A commentator who gets it wrong moves on. When the two disagree, it is worth considering which incentive structure is more likely to produce useful information. Currently, the bond market’s assessment remains far more restrained.
What This Means for Your Portfolio
The recent oil shock is meaningful, and its ultimate inflationary impact (or lack thereof) will take time to emerge in the data. While the story of 2026 is still unfolding, the evidence available today does not support the level of alarm suggested by current headlines. Bond markets are calm. The absolute price level, while elevated, is below the 2022 peak. The direct pass-through from energy prices to core inflation remains structurally limited. And policy and inventory buffers are more substantial than during the last comparable shock. More importantly, the portfolios we manage are not constructed on the assumption that world markets will remain calm. They are designed to absorb shocks through diversification, thoughtful allocation, and discipline in an attempt to avoid reactive decisions driven by the narrative of the moment.
Sources: YCharts, Brent Crude Oil Spot Price, March 2026. U.S. Bureau of Labor Statistics, Consumer Price Index — December 2025, released January 13, 2026. Federal Reserve Bank of Dallas, Kilian & Zhou, “A Broader Perspective on the Inflationary Effects of Energy Price Shocks,” Working Paper 2224, December 2022. Dimensional Fund Advisors, “Light at the End of the Inflation Tunnel?” June 2022. Federal Reserve Bank of St. Louis (FRED), T10YIE, T5YIE, March 2026. International Energy Agency, Oil Market Report, March 2026. U.S. Energy Information Administration, Short-Term Energy Outlook, March 2026.
A Note on Factor Performance: Small and Value in Q1
One development in Q1 warrants a brief mention — not as a confirmed forecast, but as an observation consistent with a long-held perspective. After years of underperformance, both small-cap and value-oriented stocks outperformed during a quarter marked by uncertainty.
Contrary to the headlines, value outperformed growth across the market In Q1. Concentrated, mega-cap growth exposure bore the brunt of Q1’s volatility, while a diversified, value-oriented approach held up more effectively. These outcomes were not a prediction realized, but a reminder that long-term premiums rarely arrive on schedule, patience remains essential, and evidence for long-term reward is compelling even through extended periods of uncertainty like Q1.
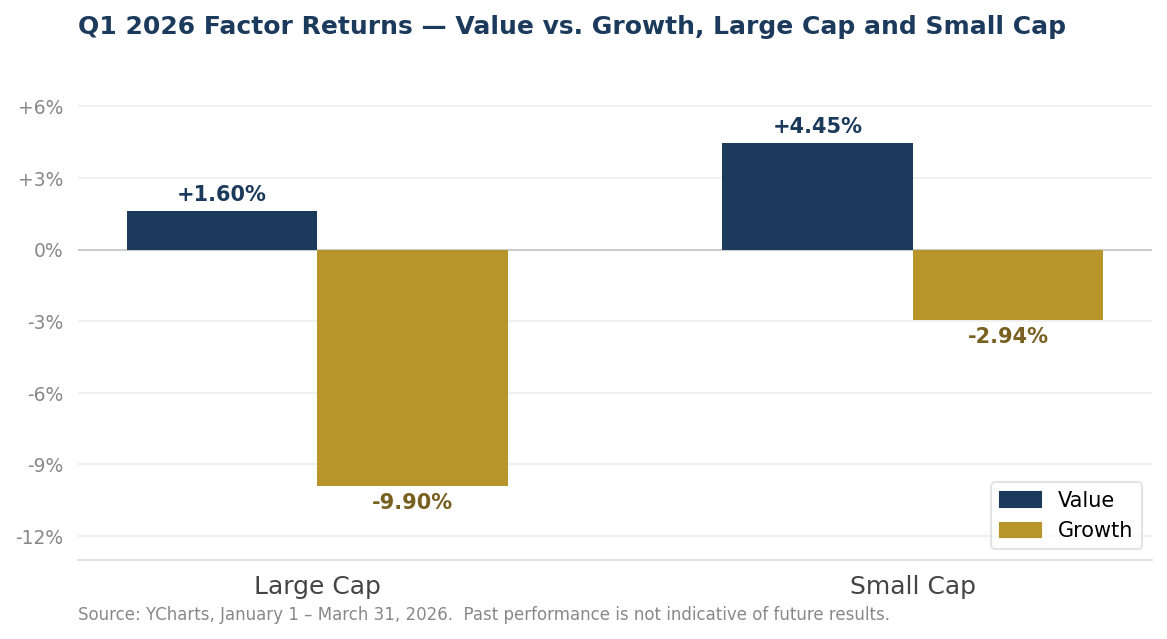
| Factor Performance Chart: Value vs. Growth, Large Cap and Small Cap |

| Small Cap Size Premium: “Small Cap Stocks Outperformed in Q1 2026” |
Source: YCharts, January 1 – March 31, 2026. Russell 1000 Value (^RLV), Russell 1000 Growth (^RLG), Russell 2000 Value (^RUJ), Russell 2000 Growth (^RUO). Past performance is not indicative of future results.
Disclosures
TCI Wealth Advisors, Inc. is an SEC registered investment advisor. This material has been prepared for informational purposes only. Due to various factors, including changing market conditions and/or applicable laws, the content may no longer be reflective of current opinions or positions. No client or prospective client should assume that any information contained herein serves as the receipt of, or a substitute for, personalized advice from TCI, or from any other investment professional. Please remember that different types of investments involve varying degrees of risk, and there can be no assurance that the future performance of any specific investment or investment strategy (including those undertaken or recommended by TCI), will be profitable or equal any historical performance level(s). No amount of prior experience or success should be construed that a certain level of results or satisfaction will be achieved if TCI is engaged, or continues to be engaged, to provide investment advisory services.

