

I went back and forth on the following opening and how best to phrase it:
- Believe it or not, we’re only about 75 days away from the election, or…
- Somehow, we still have 75 loooong days until the election.
I’ll let you choose which one fits your current mood better.
Nevertheless, the election is one more thing in 2020 that has the potential to cause more uncertainty and anxiety. I like to think way back to the good old days of February when a brutal election campaign in our polarized country was all we thought we’d be dealing with. Somehow, though, everything else going on has only served to heighten the impact to our psyches.
In that spirit, I wanted to look at the actual data on election years and different administrations as it relates to the stock market.
Leading into Elections
First, let’s look at the years leading into elections:
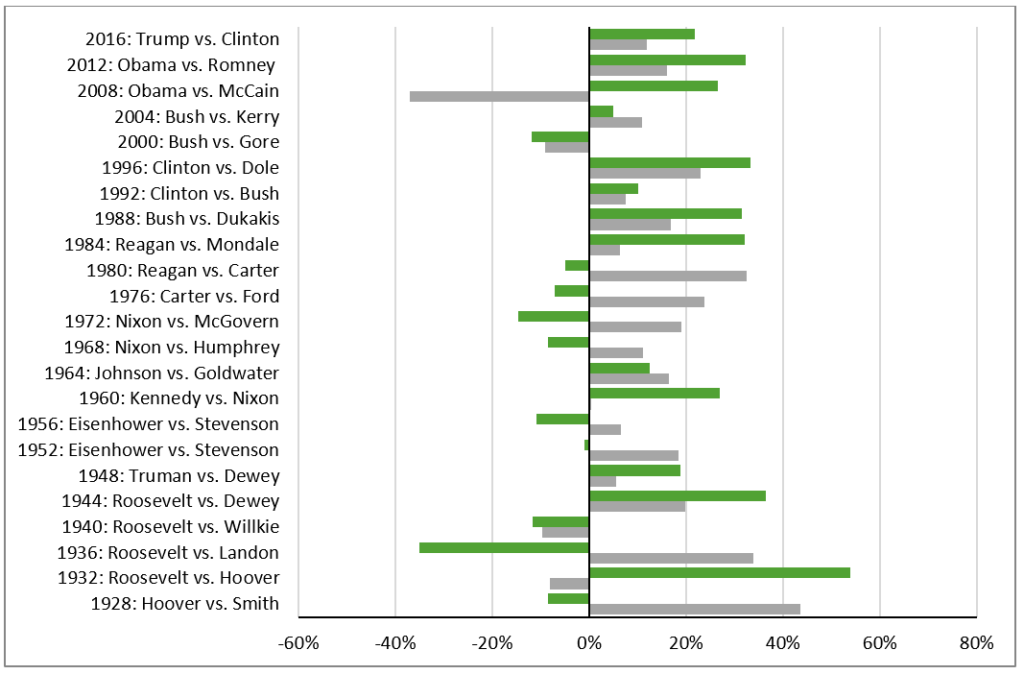
The green lines here represent the returns in years prior to the election year (average = 9.9%) and the gray lines represent the returns in the election year itself (average = 11.3%). It looks a lot like the overall history of the stock market because it basically is. The years leading into and containing an election represent half of all of the years available and so it shouldn’t be surprising that the data look very similar to the entire history of the market—random overall with far larger upswings then downswings over time. For some reason, the conventional wisdom has settled on the fact that election years are odd, but the facts don’t bear that out. There’s another piece of conventional wisdom that says market volatility increases in the months and weeks prior to an election, but the data is also inconclusive on that front (you can find papers claiming that’s true and papers claiming that’s false). It’s much more likely that we are hyper aware of daily market movements in the lead up to an election and falsely attribute volatility to that when the reality is that markets have high daily volatility nearly all the time.
Market Returns
Perhaps then, the result of the election matters more. Here are the market returns for different presidential terms:
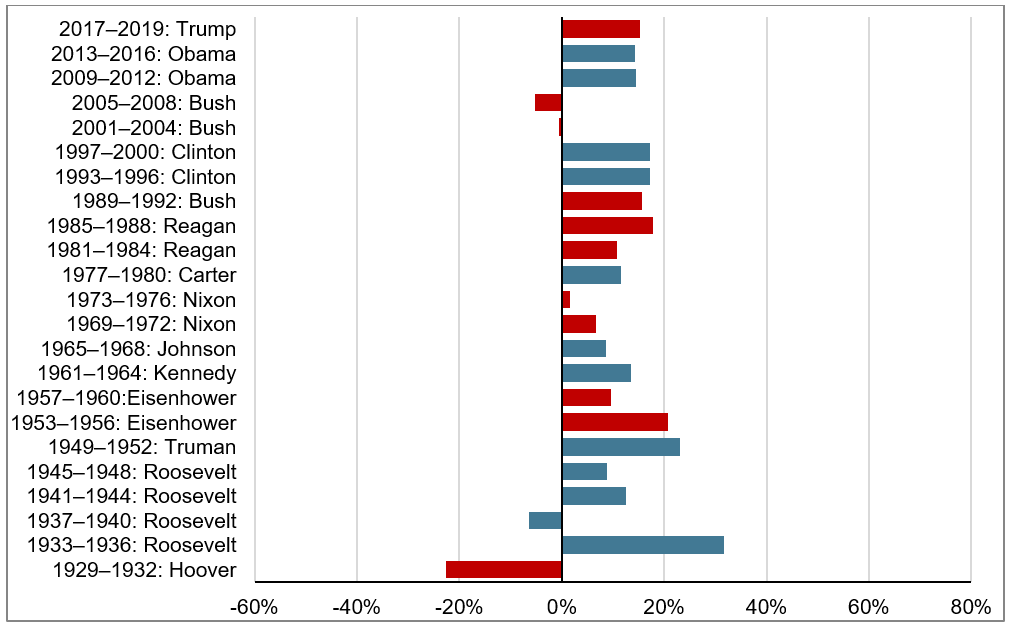
Again, this shouldn’t be that surprising. If we take any four-year period in the history of the market, it’s likely that returns will be positive. Of course, it’s not a guarantee so we do end up seeing negative returns through a few presidential terms.
Surprisingly, there is, in fact, a significant split between party control of the White House. Republican administrations through 2019 averaged around 9.6% through their terms while Democratic administrations averaged around 14.5%. Of course, starting with Hoover and the worst years of the Great Depression is going to have a major impact and that single term alone is responsible for most of the gap.
I should also point out that a well-diversified global portfolio is not simply US stocks. About 40-50% of the world’s publicly traded stocks by market capitalization lie outside the US. Here are the patterns we see in the international stock markets:
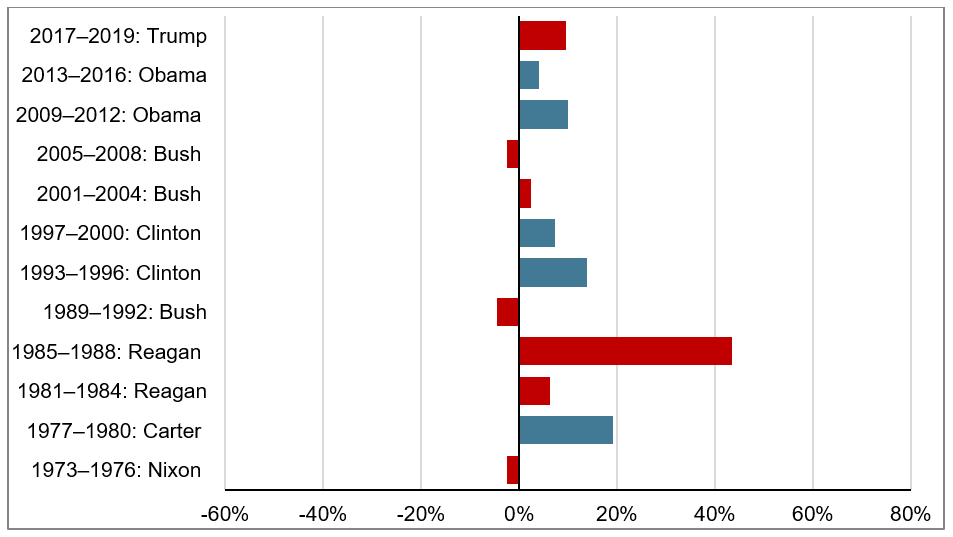
There’s not as much available data, but the same pattern roughly holds—there is little correlation between the presidency and stock market returns and there is certainly no evidence of causation.
Does it matter?
On a scale of things that matter to the performance of stocks, who is in office matters very little. Presidents get far too much credit and far too much blame for the movements of the stock market. It’s not that presidential administrations can’t have an effect on economic variables which do tend to drive long-term performance—their policies certainly do just that—it’s that companies will make adjustments to new policies over the long-term and continue to grow.
Let’s take tax rates as an example. Suppose an administration pushes through a change to raise corporate tax rates. It’s likely there would be some short-term shock as investors realize they will receive less profits than they thought in that immediate year. But companies adjust quickly to the new rules. Perhaps they raise prices or cut lines of business that are no longer profitable under the new laws. Perhaps a raise in taxes leads to a raise in benefits to lower income people and that leads to greater consumer spending and new markets for businesses to enter. The point is a new equilibrium will be reached. The markets have seen all kinds of policies from the left and the right over the last 100 years and they have continued to grow through them all.
Familiarity Bias
In the end, elections and politics and the concern over how they affect the stock market are great examples of familiarity bias. The current news media is set up to cover presidential elections as the world’s greatest reality show and so we can’t help but to have it front and center in our minds. As mentioned earlier, about 40% of our stocks are invested internationally, but we don’t fret about what the next Japanese, Indian, or Spanish election is going to do to our portfolio. Yet we do it with our own elections as a byproduct of our heightened awareness and familiarity with the impact it can make on other parts of our lives.
Presidential politics matter greatly for our society, but they don’t matter that much for the markets. So get involved with what you believe in. Fight for the direction you want the country to go in. Just don’t worry about it in the context of your portfolio. There are far more important issues at stake.

