

So that’s what market volatility feels like! It had been a while since we’d had dramatic swings in stock markets across the globe, but these past two weeks have been a reminder of how volatile markets will be from time to time.
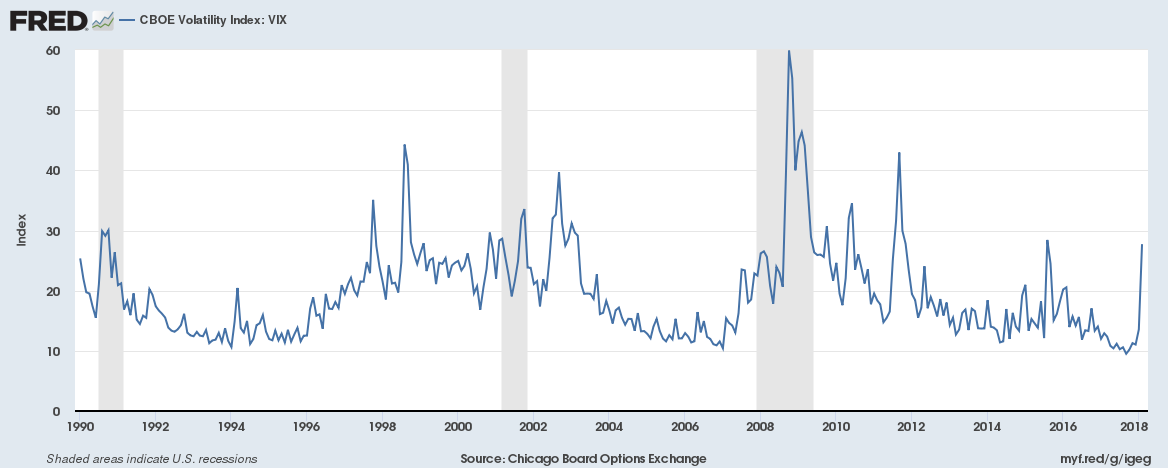
U.S. stocks returned just over 21% last year. As measured by the Center for Research in Security Prices (CRSP), 2017 was the 32nd best performing calendar year return for U.S. markets going back to 1926; or, said another way, one out of every three years has produced returns at least as good as 2017. From a return perspective, it was well within the range we should expect. Where it was a bit unique, however, was from a volatility perspective. The VIX, a standard measure of market volatility that gives us data back to 1990, was at historic lows for most of 2017:

2017 was not unprecedented from a volatility perspective, but levels that low are a bit rare. All of which is to say that what we’ve experienced the past couple weeks is far closer to historical norms for the market from a volatility perspective. Here’s the same graph as above with the first 6 week of 2018 included where you can see the spike back to “normal” ranges:
As a long-term investor with a portfolio allocation dialed in to meet your long-term goals, it’s important to remember that markets like this are expected and accounted for in your plan. The easiest way to negatively impact a plan is to react to sensational headlines and, boy oh boy, are there some doozies out there.
There are two big themes that show up more often than the others—remember that the headline writer’s goal is to get clicks!
Theme #1: The DOW Has Biggest Point Drop Ever
First off, the Dow is an inappropriate benchmark as it relates to a globally diversified portfolio—just because it’s familiar does not make it relevant. Second, relativity matters. A one thousand point drop is not the same thing as it was ten, twenty, or thirty years ago when the index level was lower. The percentage is what matters—according to S&P Dow Jones Indices, Monday was actually the 100th worst percentage point drop in history. In other words, days like that happen on average once per year. Rare, to be sure, but that’s a major change in context from “largest point drop ever!”
Theme #2: These Daily Swings Matter and You Need To Be Doing Something About It
They do not, and you don’t.
I sense these headlines will only continue to get worse through the years, especially now that politics has become intertwined. It’s hard to think of something dumber than the random fluctuations of an irrelevant index forming partisan talking points, but it nevertheless creates an easy gateway to mix emotions and investing which is never a good combination
The bottom line is that the recent volatility we’ve experienced is relatively normal and we expect for it to happen frequently. More importantly, the allocation you and your advisor have honed in on to give you the best chance of meeting your goals accounts for far more relevant long-term market possibilities. Stick to the plan—nothing in the past two weeks has fundamentally changed.

